April 23, 2026
Our quarterly SaaS Valuation Insights report focuses on the TLCF SaaS Index (“TSI”), offering in-depth analysis of its constituents, valuation and M&A trends, as well as insights into the broader European SaaS landscape.
TSI distinguishes itself from other adjacent indices in terms of constituent characteristics and size. Comprising predominantly Nordic and European small to mid-sized public SaaS companies, our index includes 116 companies, with 44% headquartered in the Nordics, 22% in other parts of Europe, 27% in the United States, and roughly 7% in other global markets. Notably, our index purposefully excludes large-cap SaaS companies.
We firmly believe that our proprietary index serves as an effective valuation benchmark for small and mid-sized SaaS firms, which are the typical transactional focus within our core European markets.
Report highlights
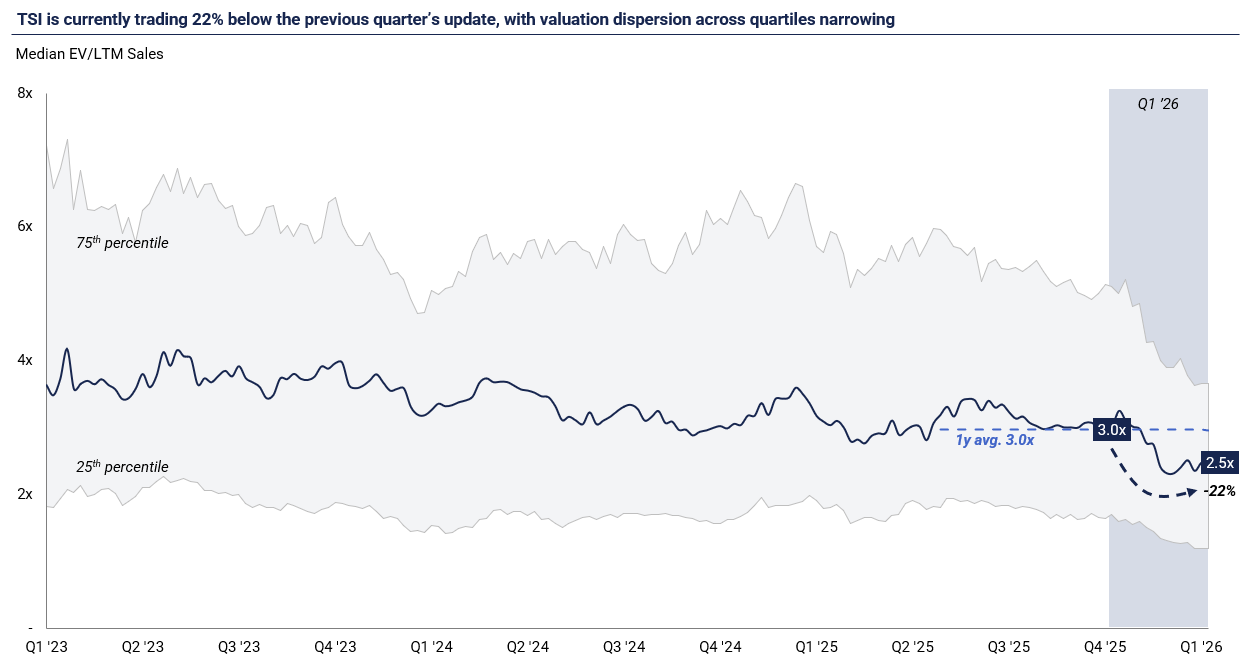
Indiscriminate selloff, selective recovery: Q1 ’26 marks a market-wide repricing of the SaaS sector, with valuations adjusting faster than fundamentals. Sometimes referred to as the “SaaSpocalypse”, the selloff has hit companies largely irrespective of individual profile, growth quality or AI positioning. TSI closed the quarter at 2.5x LTM Sales, 22% below the previous quarter and well below the 3.0x three-year average. We see the next chapter as dispersion, not extinction: valuations are likely to reflect AI resilience, vertical defensibility, and the ability to translate software into measurable customer value.
AI is repricing the business model, not just the multiple: DCFs now price a non-trivial probability of AI substitution by T+5, compressing terminal value even for names whose near-term KPIs hold up. Public and private investors are converging on a single core issue — AI durability is no longer one concern among many; it is the defining concern. At the same time, seat-based pricing is coming under pressure as outcome-based approaches gain momentum, though the shift is still more narrative than reality. A gradual move toward outcome-based models will transfer underwriting risk to the vendor and reward only those platforms where customer ROI is measurable. Feature differentiation is also decaying as a moat, as AI coding assistants and agent-driven development collapse the cost and time required to replicate a SaaS feature set. Durability now sits in proprietary data, workflow embedding, regulated distribution and outcome-aligned pricing. Finally, we expect 1–2 years of visible gross margin pressure as inference costs flow through before AI pricing uplifts feed back into the model.
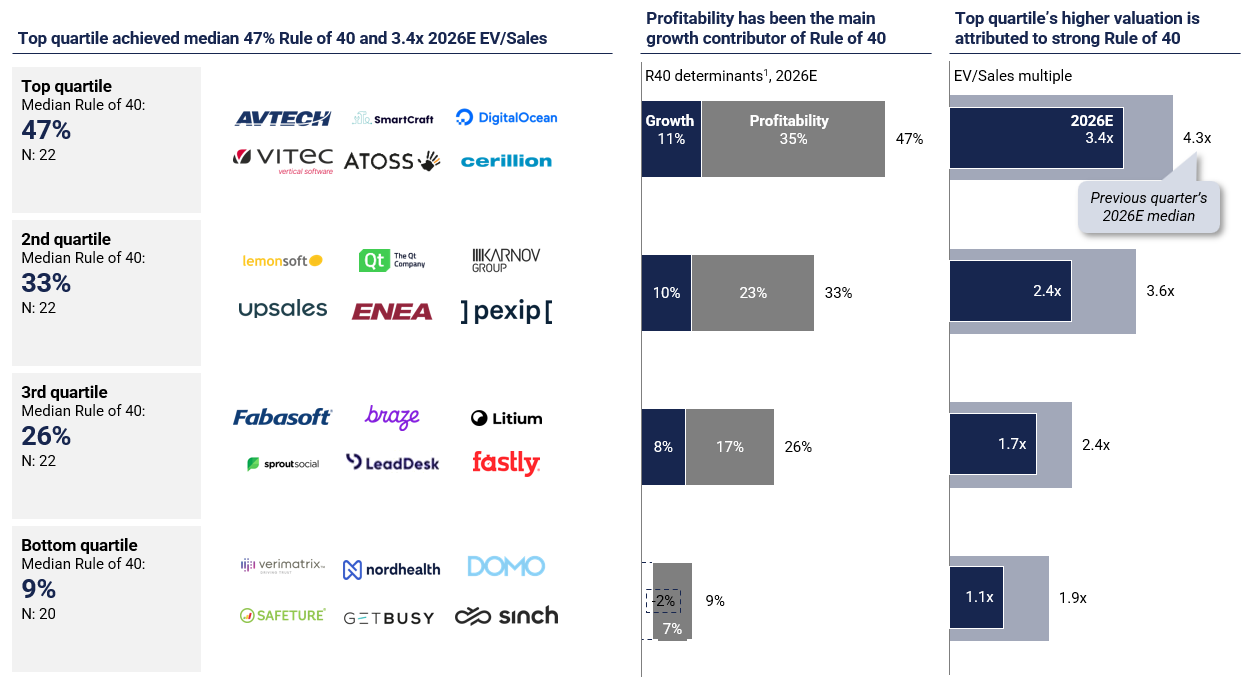
Top-quartile outperformance, but no pocket is immune: Top-quartile constituents continue to deliver a median Rule of 40 of 47% and a 2026E EV/Sales multiple of 3.4x, well above the lower quartiles at 2.4x, 1.7x and 1.1x respectively. However, even the top-quartile multiple has compressed from 4.3x in the previous quarter, underscoring that the repricing has touched every performance tier. The dispersion between best- and worst-performing TSI constituents continues to widen, reinforcing selectivity as the dominant investment theme.
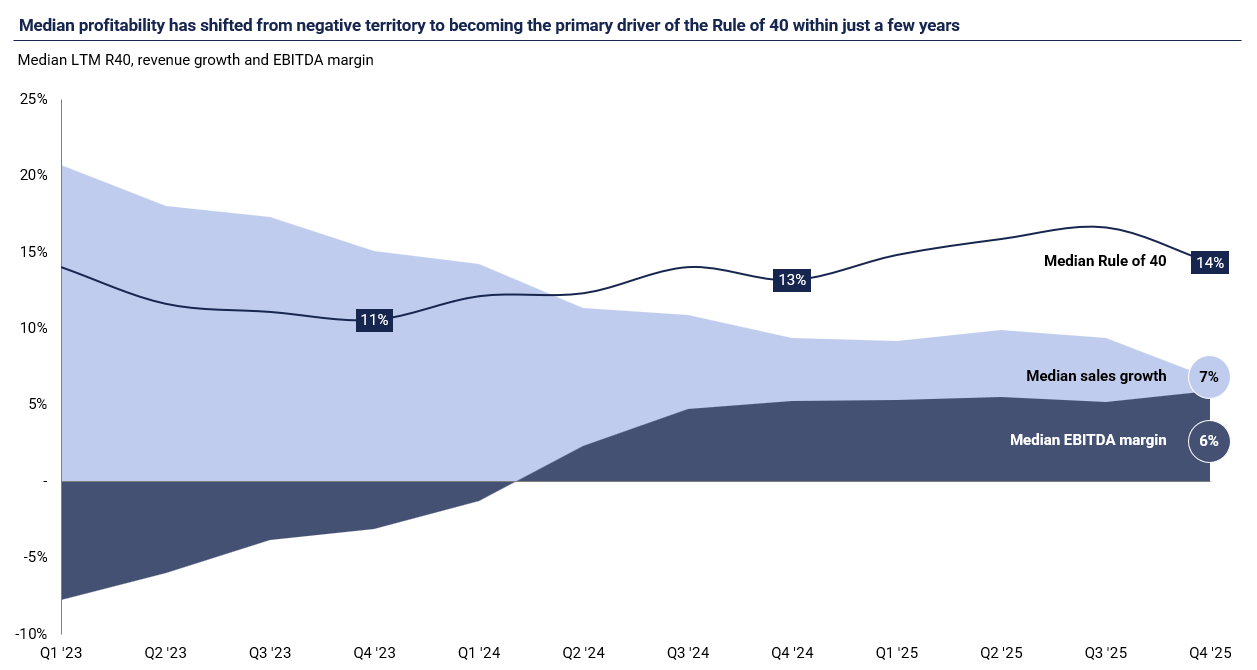
Rule of 40 continues to rebalance toward profitability: Median Rule of 40 has drifted modestly upward since 2023, reaching 14% in Q1 ’26, driven entirely by margin expansion as top-line growth continues to decelerate. Median profitability has moved from negative territory to become the primary driver of the metric in under three years. Fewer than 15% of TSI constituents now deliver annual growth above 20%, with those that do continuing to command premium multiples, particularly within vertical SaaS.
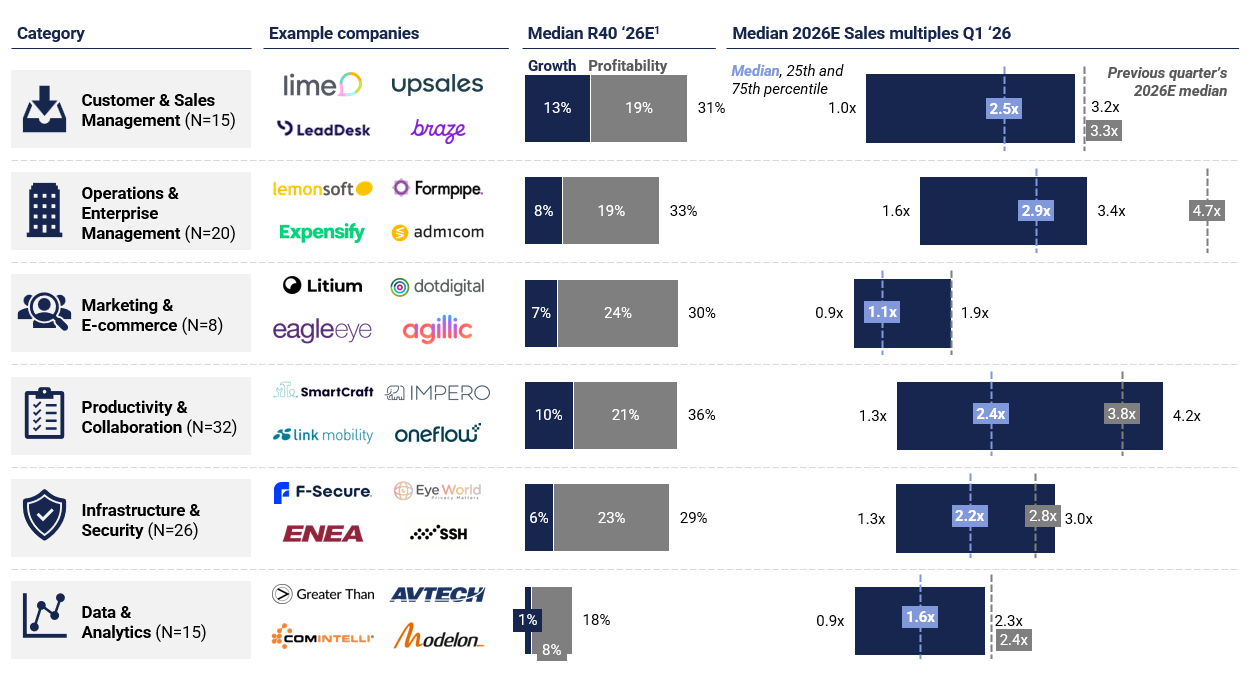
Operations & Enterprise Management retains its stickiness premium: Category-level dispersion remains a defining feature of the index. Operations & Enterprise Management SaaS vendors, many of them ERP or ERP-adjacent, continue to command the highest 2026E EV/Sales multiples at 2.9x, supported by deep customer embedment, mission-critical positioning and high switching costs. At the other end, Marketing & E-commerce and Data & Analytics trade at clear discounts, reflecting weaker retention dynamics and greater exposure to generative-AI disruption risk.
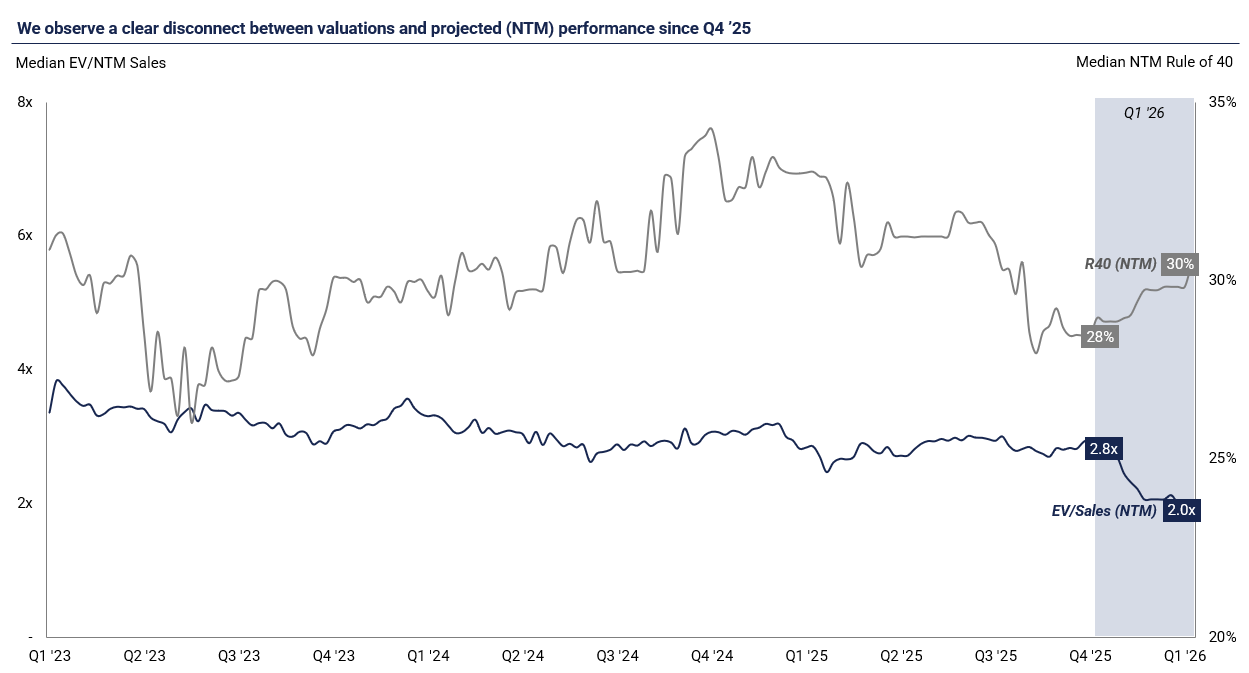
A clear disconnect between valuations and forward performance: Despite a positive outlook for both growth and profitability in 2026, the forward-looking EV/NTM Sales multiple has compressed to 2.0x, even as the median NTM Rule of 40 has edged up to 30% (from 28% in Q4 ’25). In other words, consensus expectations have held firm while prices have not – a disconnect that points to a sentiment-driven re-rating rather than any clear deterioration in fundamentals.
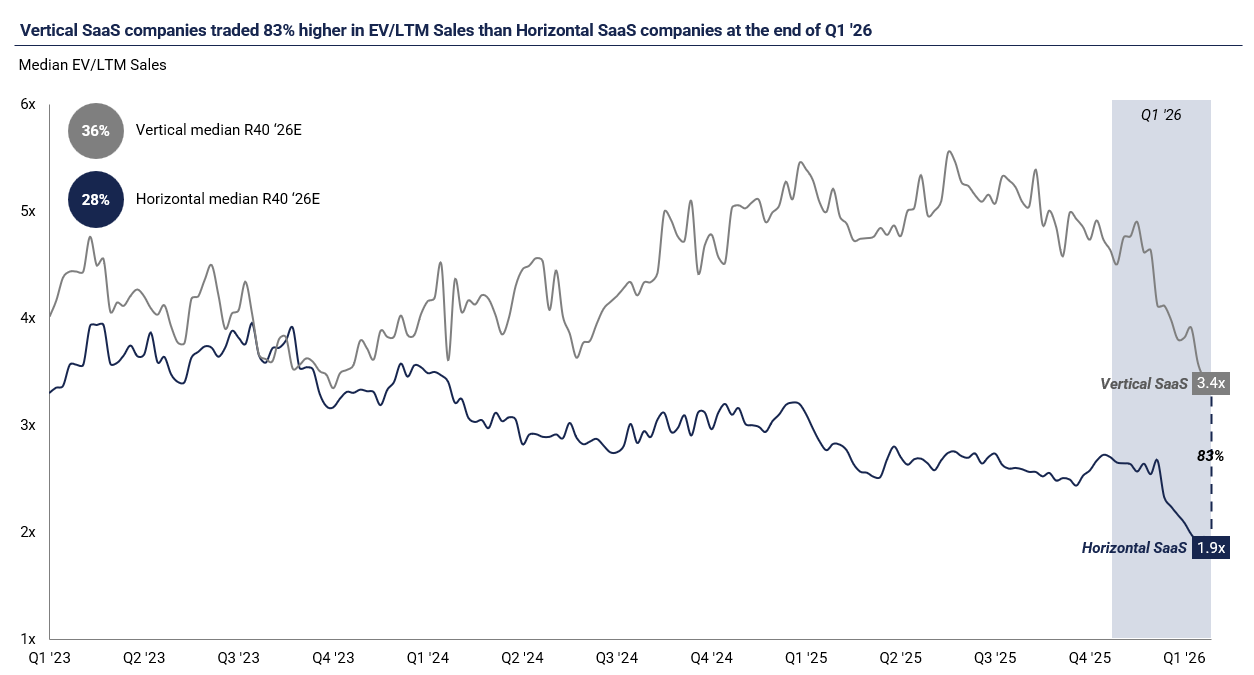
Re-rating has been broad-based, not selective: The Q1 ’26 correction has weighed on vertical and horizontal SaaS valuations in near-parallel. Vertical multiples continue to trade at a premium to horizontal peers, but the gap has narrowed as both segments re-rated, indicating that the sell-off has not been a quality-discrimination event. That said, vertical SaaS still shows a much clearer relationship between valuation and Rule of 40 performance at the stock level, suggesting that within-segment discrimination remains intact even as segment-level spreads compress.
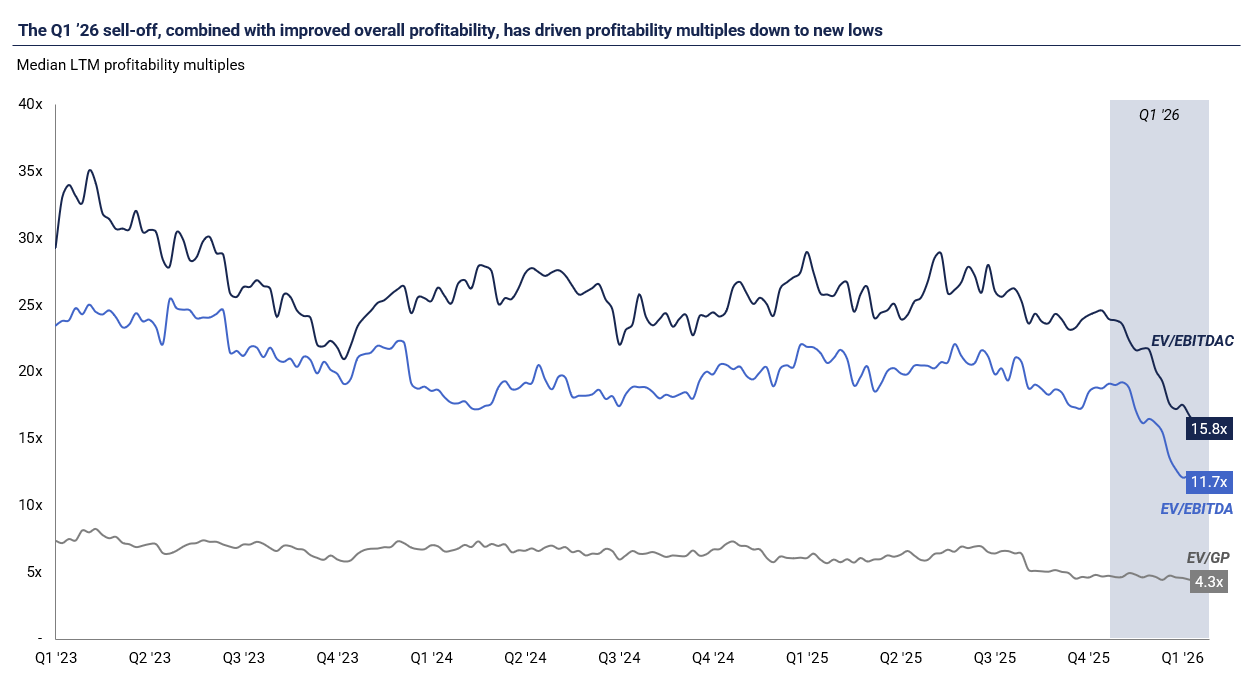
Profitability multiples have reset to new lows: The combination of the Q1 ’26 sell-off and stronger underlying profitability has pushed EV/EBITDAC and EV/EBITDA down to approximately 16x and 12x respectively, meaningfully below the ~24x and ~19x levels seen through 2024–2025. Even as the TSI has become more profitable at an aggregate level, the market is paying less for each unit of earnings. With valuation frameworks increasingly anchored on profitability and cash generation rather than pure topline volume, this compression is notable.
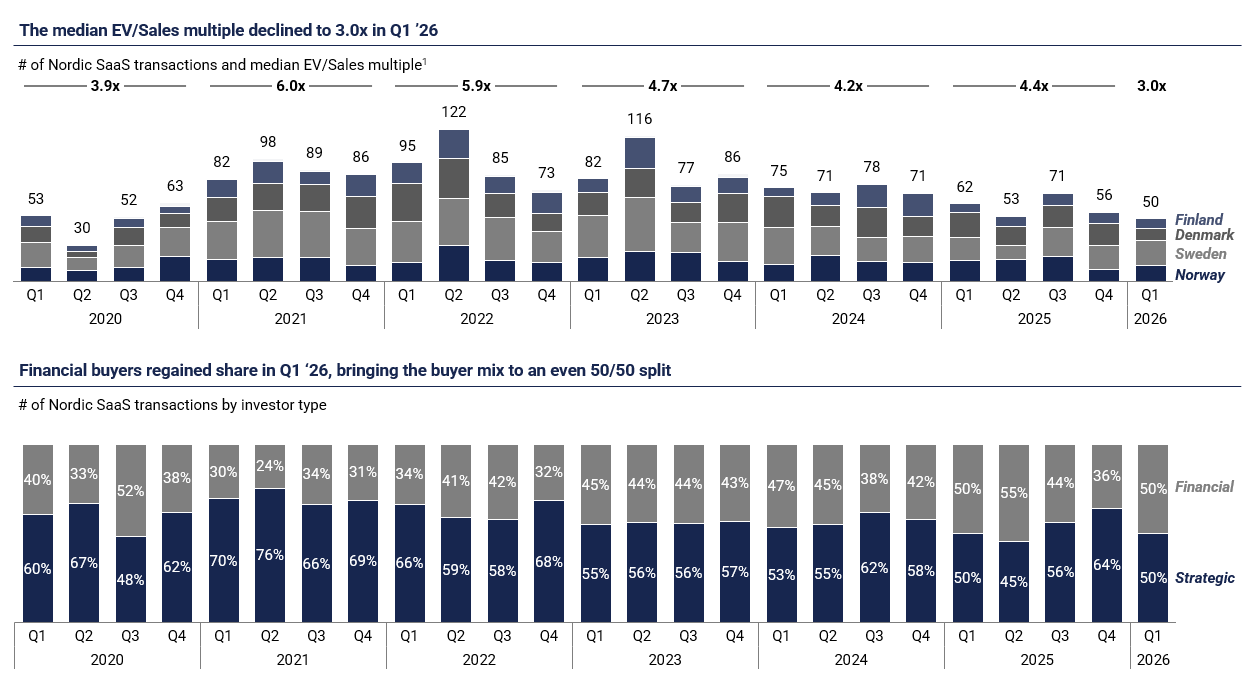
Nordic M&A activity at cycle lows – Volue stands out as a clear outlier: Only 50 SaaS transactions closed in the Nordics during Q1 ’26, below the 53 deals recorded at the onset of Covid-19 in Q1 ’20, and the weakest opening quarter since we began tracking the series. Median transaction multiples softened to c. 3.0x EV/Sales. The standout deal was TA Associates’ investment in Volue at 10.9x EV/Sales, a clear outlier against the Nordic median and a reminder that mission-critical vertical infrastructure software continues to command premium pricing, even in a weak tape.
Download our SaaS valuation insights report
In our quarterly SaaS valuation insights report, we strive to provide an overview of the latest developments and trends related to valuations accompanied with our proprietary insights and learnings from live projects and observations from engaging with both clients, strategic buyers, and investors in our cross-border advisory practice.
The full SaaS valuation insights report can be downloaded by clicking the link below, and the report will also be published on our website on a quarterly basis.
Ruben Moring, Partner at Translink Corporate Finance
Juuso Marttinen, Partner at Translink Corporate Finance
Hao Pan, Analyst at Translink Corporate Finance
