
July 15, 2026
Our quarterly SaaS Valuation Insights report focuses on the TLCF SaaS Index (“TSI”), offering in-depth analysis of its constituents, valuation and M&A trends, as well as insights into the broader European SaaS landscape.
TSI distinguishes itself from other adjacent indices in terms of constituent characteristics and size. Comprising predominantly Nordic and European small to mid-sized public SaaS companies, our index includes 114 companies, with 45% headquartered in the Nordics, 22% in other parts of Europe, only 25% in the United States, and roughly 8% in other global markets. Notably, our index purposefully excludes large-cap SaaS companies.
We firmly believe that our proprietary index serves as an effective valuation benchmark for small and mid-sized SaaS firms, which are the typical transactional focus within our core European markets.
Report highlights
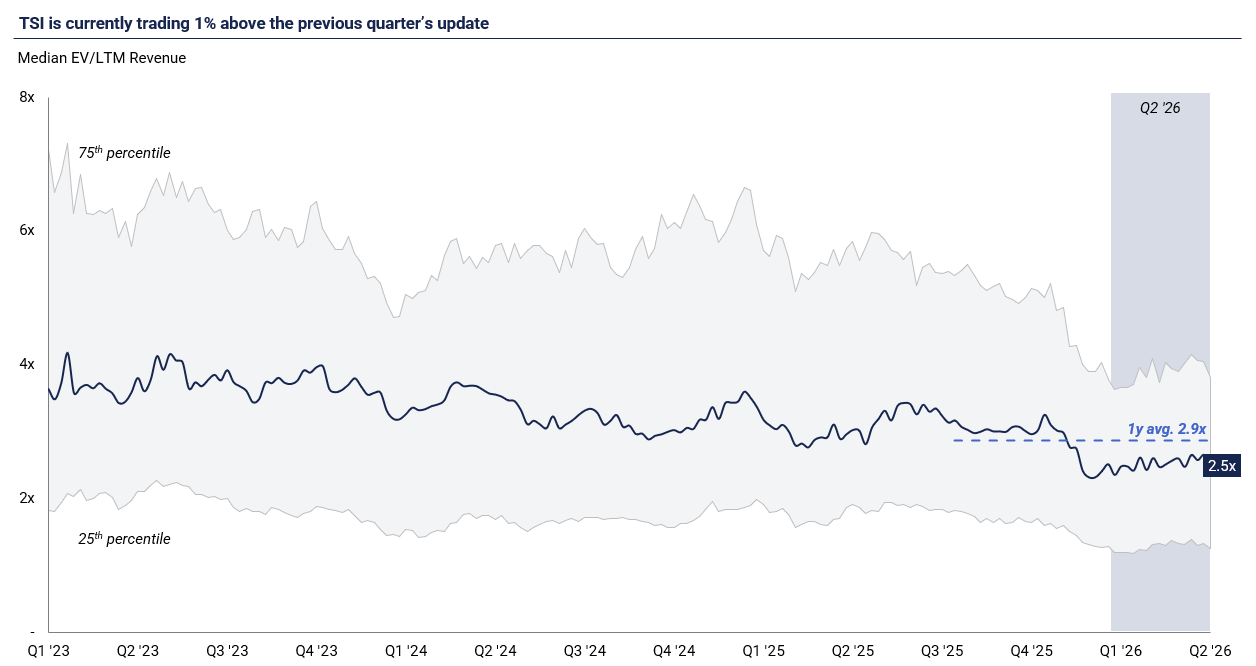
Valuations stabilised in Q2 ’26 after the sharp Q1 sell-off, but sentiment remained subdued: The Q1 ’26 sell-off, “SaaSpocalypse,” re-rated SaaS lower on fears that AI erodes long-term competitive moats and pricing power rather than on any deterioration in near-term performance. Throughout Q2 ’26, valuations stabilised as investors shifted from indiscriminate de-rating to a more selective assessment of which business models AI is likely to disrupt versus enhance. TSI ended the quarter trading at a median EV/LTM revenue multiple of 2.5x (implied EV/ARR multiple of 3.1x), unchanged from the previous quarter and below the one-year average of 2.9x. The stabilisation remained highly uneven, with isolated recoveries offset by continued de-rating across several index constituents despite stable guidance. Overall, valuation multiples remained disconnected from underlying operating performance.
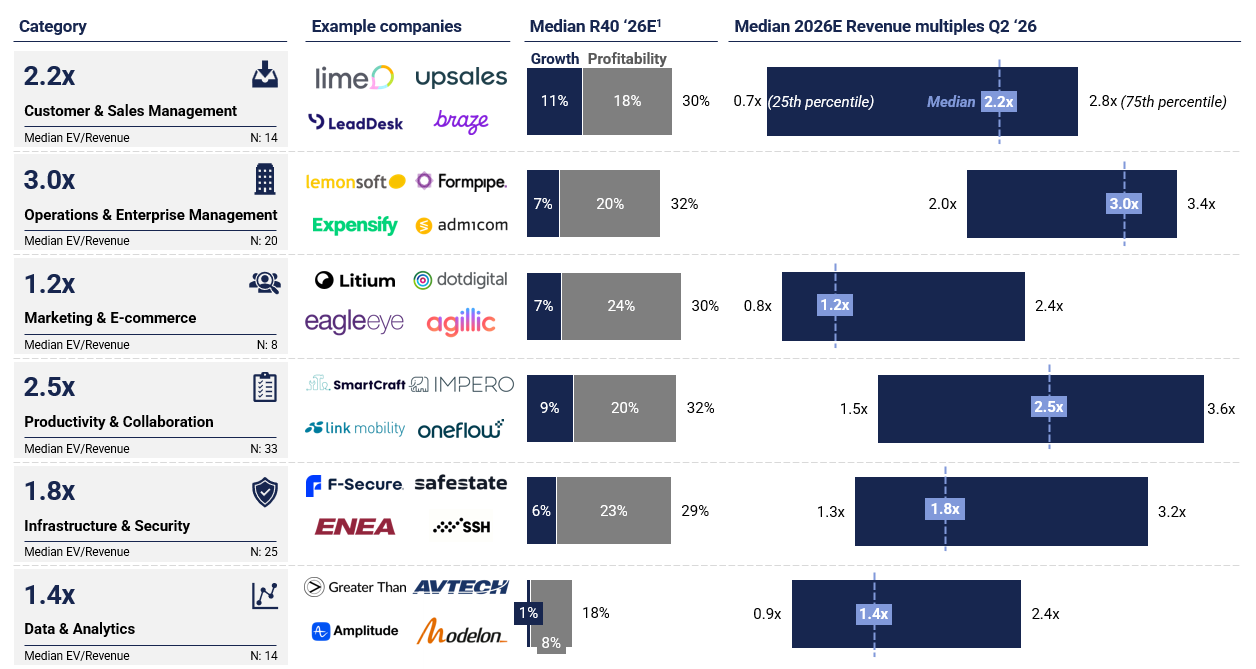
The stabilisation was broad-based across SaaS categories: No single category materially out or underperformed compared to Q1 ’26, with valuations stabilising across the board despite significant differences in absolute multiples. Operations & Enterprise Management continued to command the highest median valuation at 3.0x 2026E revenue, reflecting deep customer integration and high switching costs. By contrast, Marketing & E-commerce and Data & Analytics remained at the lower end of the range, trading at 1.2x and 1.4x, respectively, due to weaker retention profiles and greater exposure to general-purpose AI. Overall, the quarter’s stabilisation was broad-based rather than driven by any individual category.
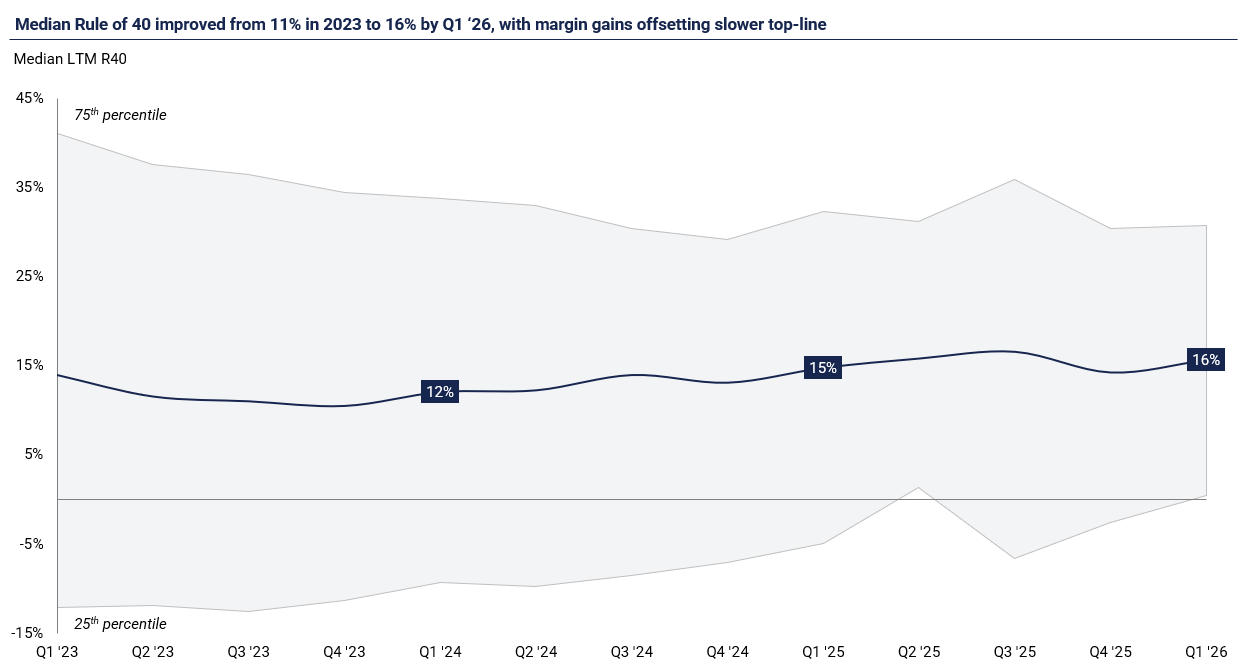
TLCF SaaS Index Rule of 40 performance: The median Rule of 40 improved to 16%, continuing its gradual increase from 11% in 2023. The improvement was broad-based, with gains visible across the distribution rather than being concentrated among the top performers. The top quartile remained close to 30%, while the bottom quartile hovered around breakeven. With performance improving across the spectrum, the data suggests a strengthening sector-wide baseline rather than a recovery driven solely by the strongest companies.
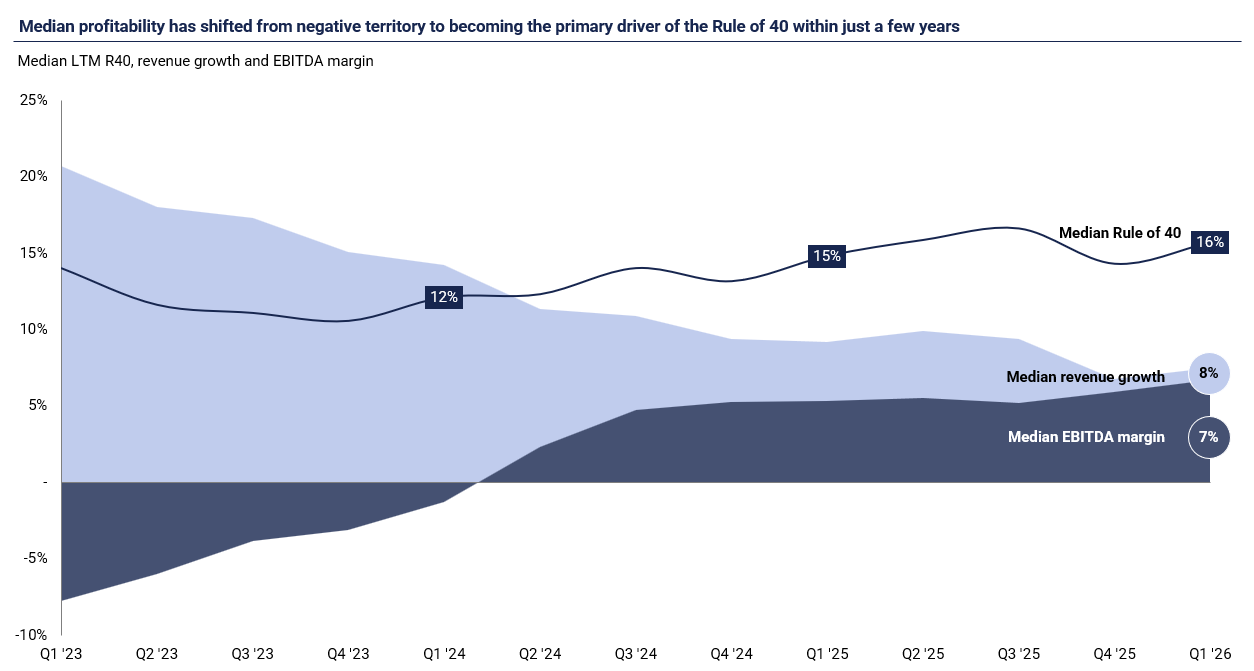
Rule of 40 composition: As highlighted in our previous reports, improvements in the aggregate Rule of 40 continue to be driven entirely by margin expansion rather than revenue growth. Median EBITDA margins have improved from negative territory prior to 2024 to break even in 2024, increasing further to 8% in 2026. Meanwhile, median LTM revenue growth has fallen sharply, from more than 20% in early 2023 to just 7% in 2026. The data highlights the market’s continued focus on profitability and operating efficiency as revenue growth becomes increasingly difficult to achieve.
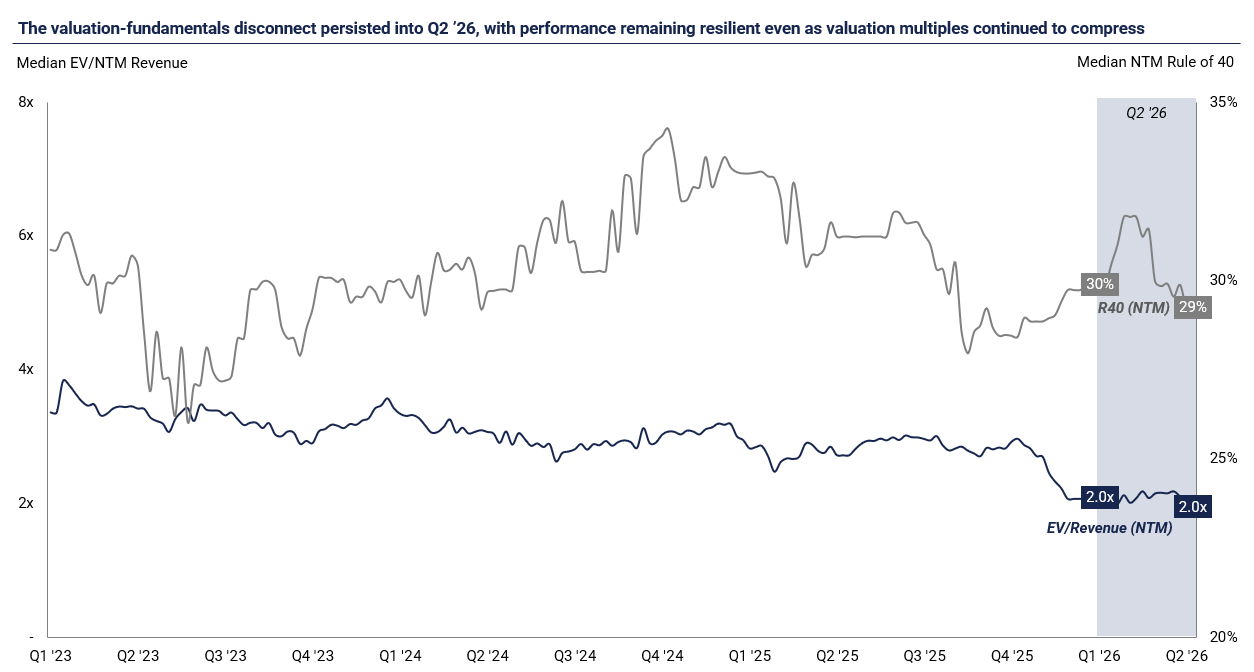
Valuations remained decoupled from outlook: EV/NTM revenue held at just 2.0x, even as the median NTM Rule of 40 stayed resilient at 29%, down only slightly from 30% the prior quarter. Multiples did not move higher despite steady forward fundamentals, a sign that sentiment, not forward outlook, is determining share price. The gap that opened during the Q1 sell-off carried into Q2, with consensus estimates holding firm while prices stalled.
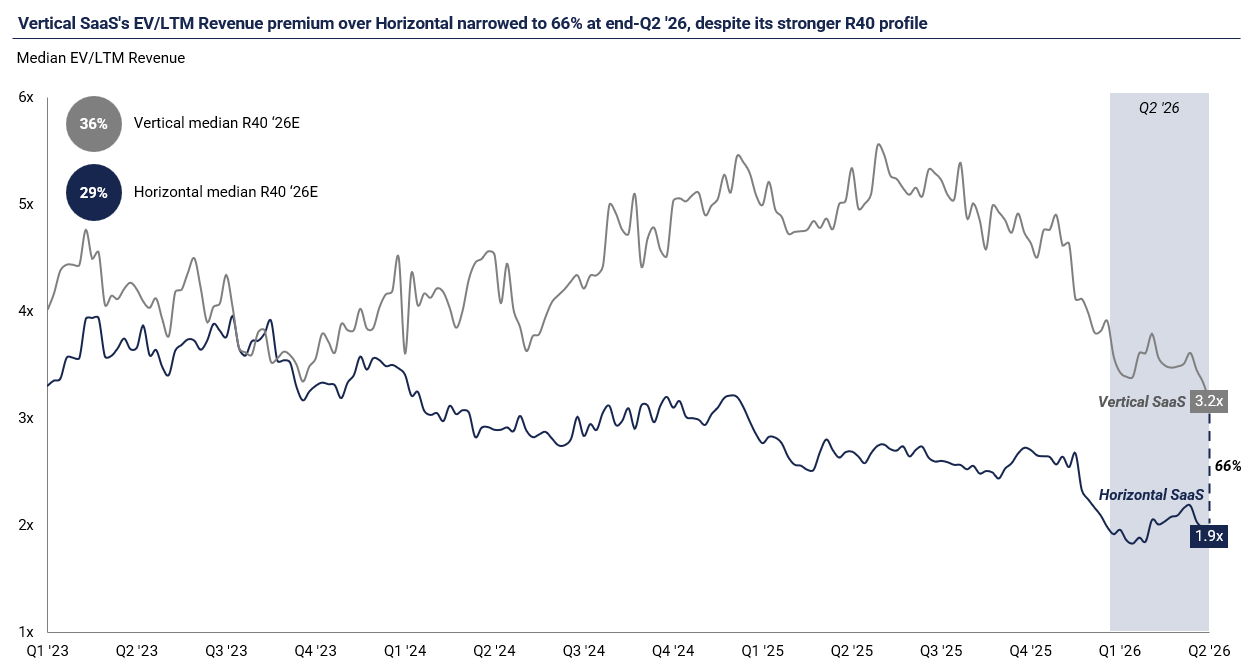
The vertical premium narrowed following a sharper re-pricing of vertical SaaS: Vertical SaaS continued to command a valuation premium over horizontal peers, trading at 3.2x versus 1.9x EV/LTM revenue, equivalent to a 66% premium. However, the gap narrowed during the quarter as vertical SaaS companies experienced a steeper re-rating. This compression occurred despite materially stronger fundamentals, with median 2026E Rule of 40 reaching 36% for verticals compared with 29% for horizontals. The market is increasingly rewarding businesses with clear AI defensibility and mission-critical positioning, rather than simply assigning a premium based on software category.
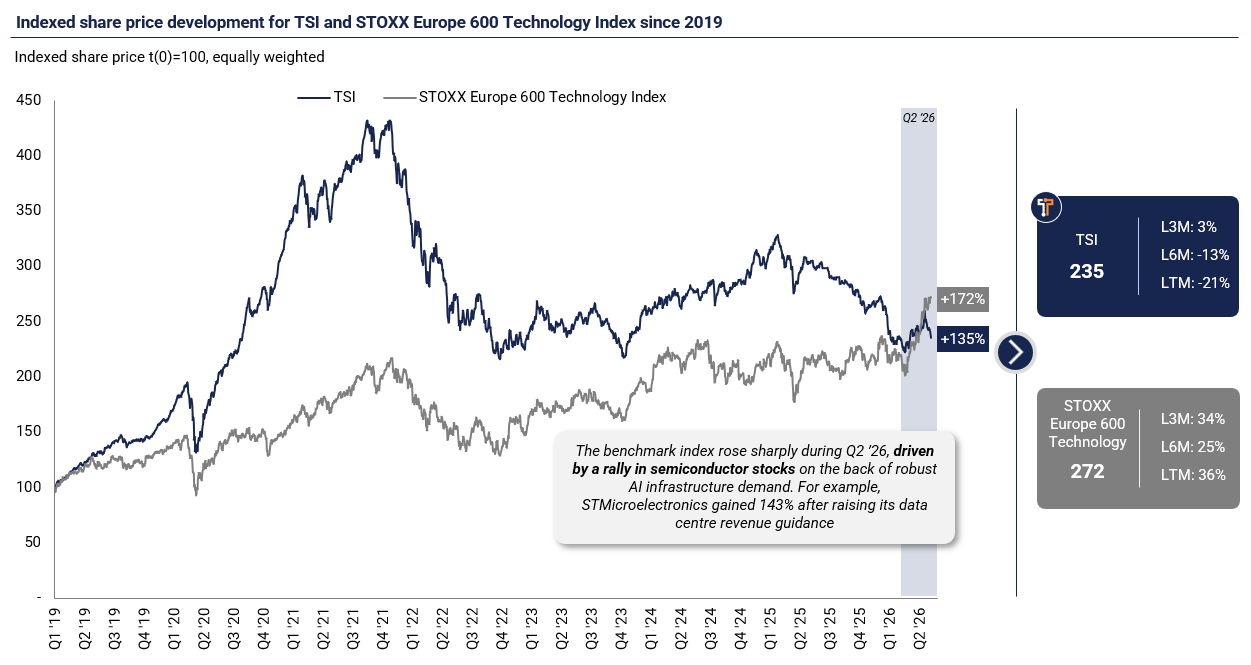
TSI lagged the STOXX Europe 600 Technology Index, driven by a rally in AI infrastructure and semiconductor stocks: Over the past twelve months, the TSI declined 21%, while the STOXX Europe 600 Technology Index gained 36%. The benchmark’s outperformance was driven by a handful of semiconductor and AI infrastructure companies that are not represented in the TSI. For example, STMicroelectronics rose 143% after raising its data centre revenue targets, while several other AI-exposed names more than doubled from their depressed Q1 lows. As a result, the TSI’s cumulative return since 2019 stands at 135%, compared with 172% for the STOXX Europe 600 Technology Index.
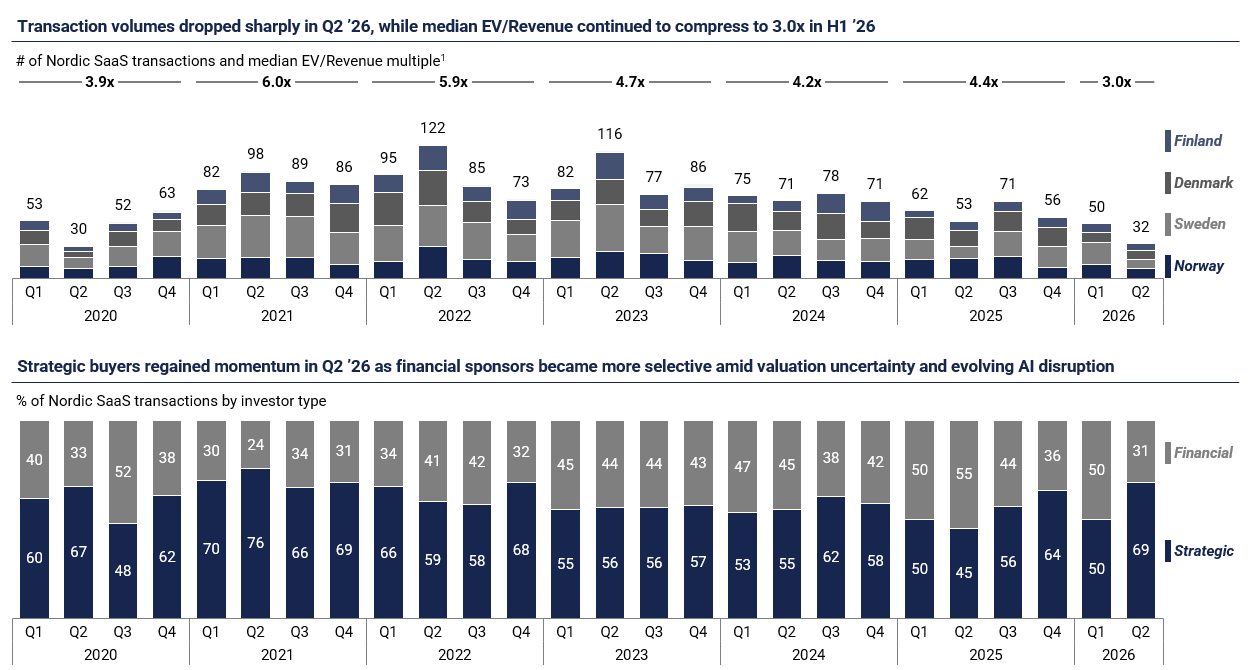
Deal activity fell to a multi-year low, yet high-quality assets continued to command a premium: Only 32 Nordic SaaS transactions were completed in Q2 ’26, marking the second-lowest quarterly deal count on record, surpassed only by the initial COVID-19 shock. AI-driven uncertainty around long-term competitive moats and pricing power continued to weigh on buyer activity. Median deal multiples declined to 3.0x EV/Revenue in H1 ’26, down from 4.4x in FY2025. Strategic acquirers remained considerably more active than financial sponsors, accounting for 69% of Q2 transaction volume as private equity investors remained cautious. Nordtech’s oversubscribed IPO in June 2026 bucked the trend, pricing at approximately 4.8x EV/Revenue and underscoring continued investor appetite for high-quality software assets despite muted M&A activity and weak public market valuations.
Download our SaaS valuation insights report
In our quarterly SaaS valuation insights report, we strive to provide an overview of the latest developments and trends related to valuations accompanied with our proprietary insights and learnings from live projects and observations from engaging with both clients, strategic buyers, and investors in our cross-border advisory practice.
The full SaaS valuation insights report can be downloaded by clicking the link below, and the report will also be published on our website on a quarterly basis.
Ruben Moring, Partner at Translink Corporate Finance
Juuso Marttinen, Partner at Translink Corporate Finance
Hao Pan, Analyst at Translink Corporate Finance
