January 27, 2026
Our quarterly SaaS Valuation Insights report focuses on the Translink CF SaaS Index (“TSI”), offering in-depth analysis of its constituents, valuation and M&A trends, as well as insights into the broader European SaaS landscape.
TSI distinguishes itself from other adjacent indices in terms of constituent characteristics and size. Comprising predominantly Nordic and European small to mid-sized public SaaS companies, our index includes 118 companies, with 44% headquartered in the Nordics, 22% in other parts of Europe, only 26% in the United States, and roughly 8% in other global markets. Notably, our index purposefully excludes large-cap SaaS companies.
We firmly believe that our proprietary index serves as an effective valuation benchmark for small and mid-sized SaaS firms, which are the typical transactional focus within our core European markets.
Report highlights
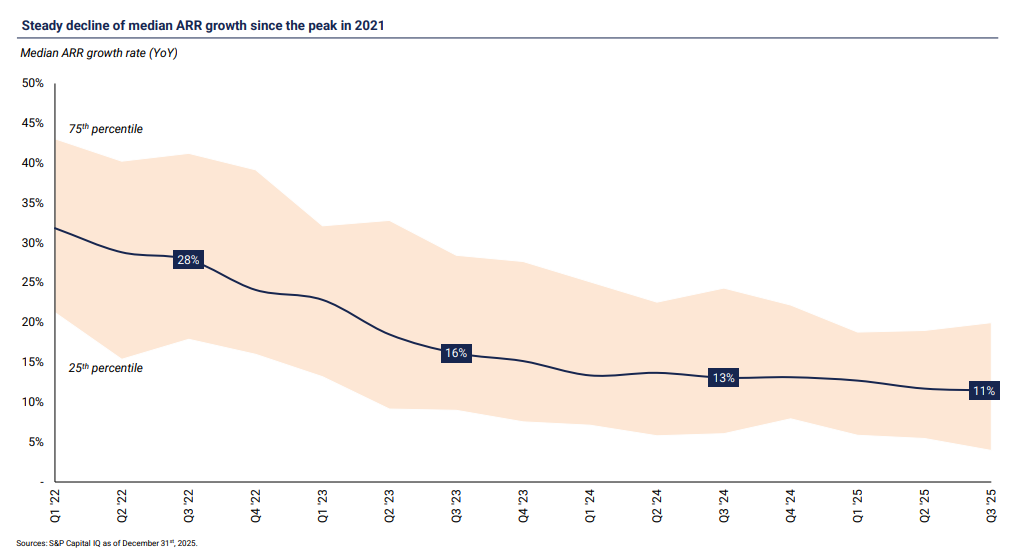
Overall ARR growth continues to decline: The market has seen prolonged deceleration, with the median ARR growth rate dropping from 28% in Q3/’22 to 11% in Q3/’25. The pace of decline has moderated in recent quarters, with growth stabilising around the low teens. At the same time, many companies have shifted focus from growth to efficiency and profitability, reflecting a broader emphasis on sustainable, high-quality growth.
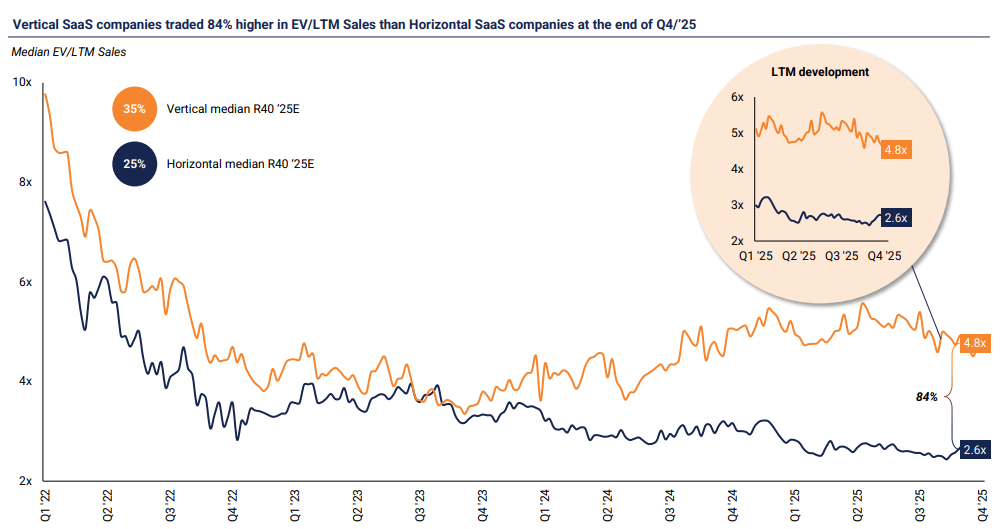
Vertical SaaS continues to outperform horizontal peers: The valuation gap has widened, with vertical SaaS now trading at an 84% premium to horizontal SaaS in Q4/’25, up from 70% in Q4/’24. The divergence is driven primarily by multiple expansion in vertical SaaS, while horizontal SaaS valuations have continued to trend downward. This reflects that investors are increasingly assigning a premium to vertical SaaS for its sector-specific defensibility and stickiness, with solutions often viewed as more mission-critical and less commoditised.
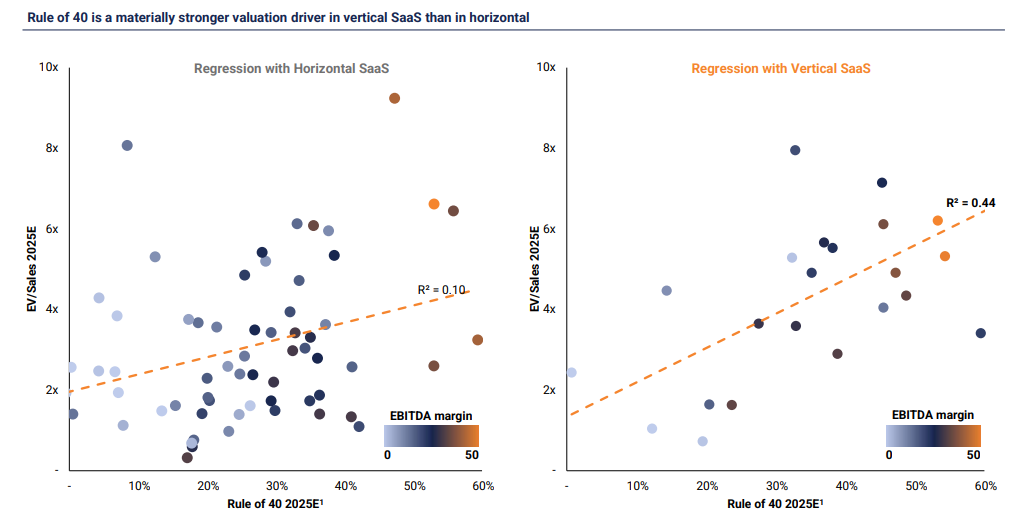
Vertical vs. horizontal valuation dynamics: Horizontal SaaS shows a much tighter relationship between valuation and performance. This pattern becomes more evident when vertical and horizontal SaaS companies are analysed separately rather than on an aggregated basis. Doing so shows that strong vertical Rule of 40 companies are rewarded more consistently than their horizontal peers, where the relationship is far less pronounced. This more systematic pricing of performance helps support the segment-level premium, even though individual high-performing horizontal companies can still trade at valuations above many vertical peers.
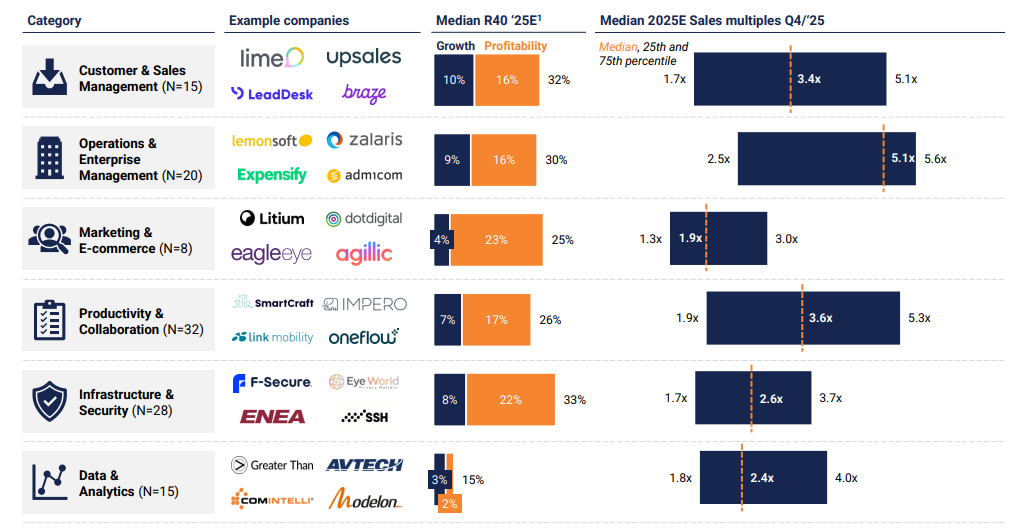
SaaS category valuations vary meaningfully: Sales multiples differ materially across categories, reflecting differences in growth, profitability, and perceived resilience. Operations and enterprise management stands out as the highest-valued segment in Q4/’25, with a median EV/Sales multiple of 5.1x, supported by strong Rule of 40 performance. The category includes many ERP and ERP-adjacent platforms, which typically benefit from mission-critical positioning, deep customer embedment, and high switching costs, helping sustain premium valuation levels relative to other SaaS segments.
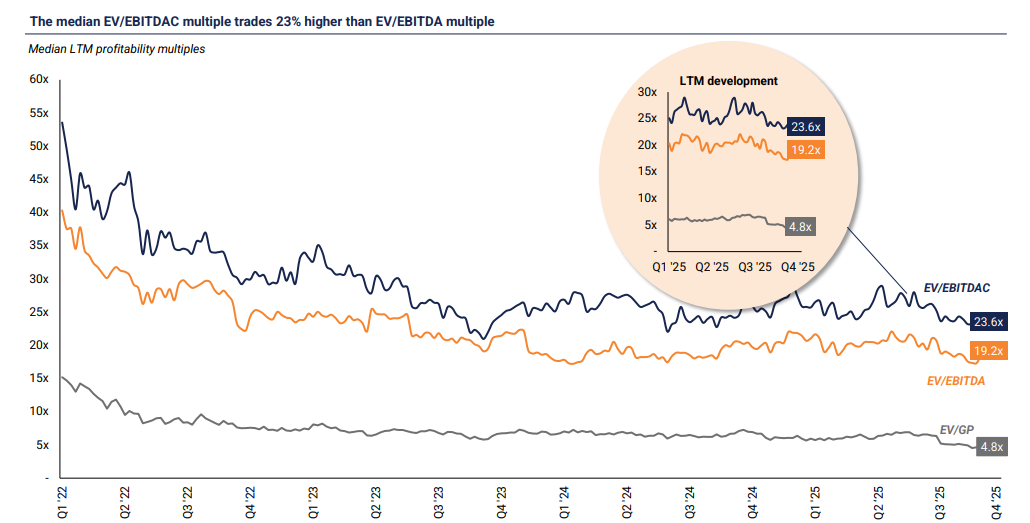
Profitability multiples held steady: Profitability multiples have remained broadly stable since 2023, with median EV/EBITDAC trading at ~24x and median EV/EBITDA at ~19x. As investor focus has shifted toward profitability amid widespread growth deceleration, metrics such as EV/EBITDAC have become increasingly central in assessing SaaS valuations. This is intuitive, as valuation frameworks are ultimately anchored in profitability and cash generation rather than purely volume, which on its own is a weak proxy for a company’s ability to fund growth or return capital to investors.
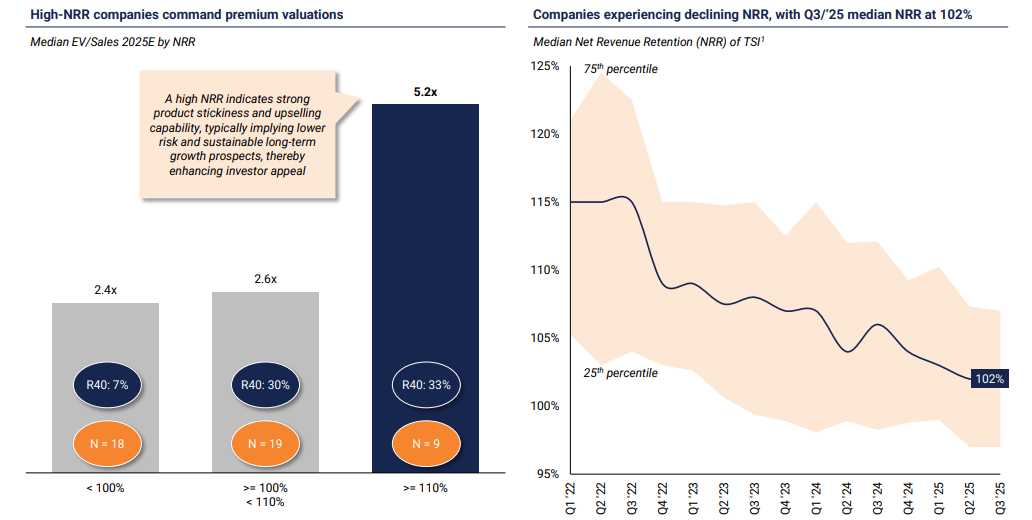
High-NRR companies command premium valuations: Companies with NRR above 110% continue to trade at clearly higher valuations than lower-retention peers, with the median EV/Sales multiple at 5.2x versus 2.6x for companies in the 100% to 110% range and 2.4x for companies below 100%. High-NRR companies also show stronger overall performance, with a markedly higher Rule of 40, reinforcing that strong retention and upsell dynamics remain a key indicator of durable growth and long-term value creation. At the same time, the broader market is seeing declining retention, with the median NRR trending down and reaching 102% in Q3/’25.
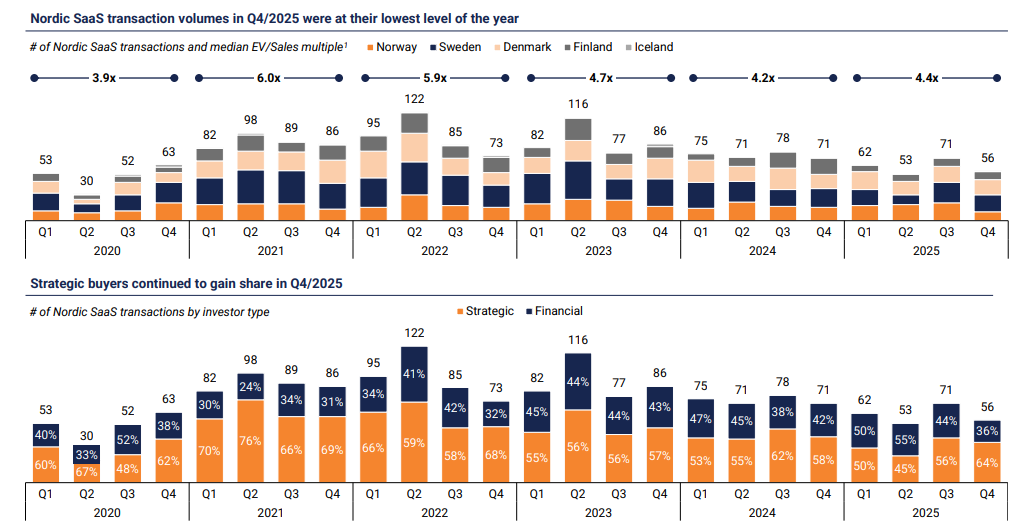
Nordic SaaS transaction volumes remained subdued in 2025: Total Nordic SaaS transaction volume declined to 242 deals in 2025 from 295 in 2024, while valuations levels increased slightly, with the annual median EV/Sales multiple increasing to 4.4x from 4.2x. Strategic buyers represented around 54% of Nordic SaaS deals in 2025, down slightly from around 57% in 2024, with strategic deal count declining to 131 from 168.
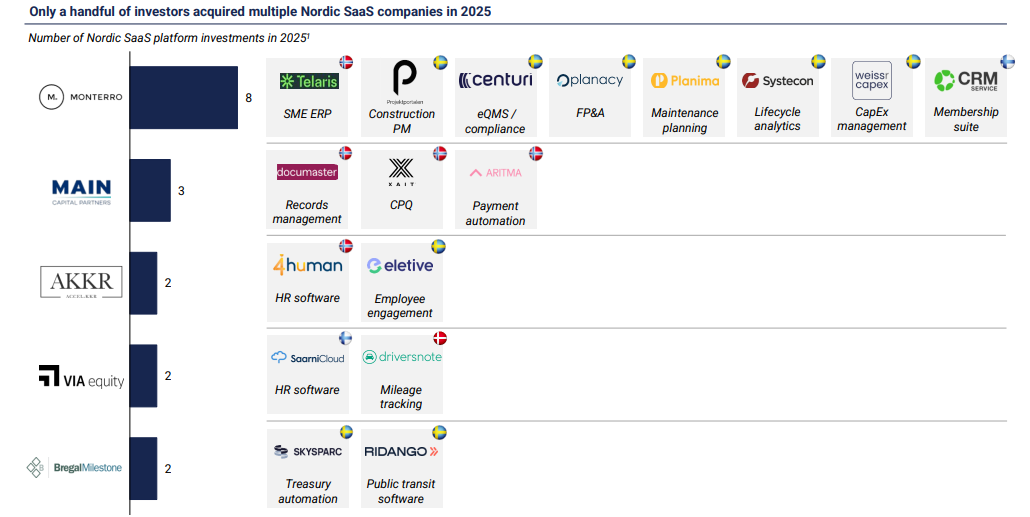
Only a handful of investors made more than two Nordic platform investments in 2025: Monterro was by far the most active, completing eight Nordic platform investments across a wide range of verticals. A small number of others closed two or three platform deals during the year, while most investors completed just one. The ranking excludes add-on acquisitions, of which there were plenty in 2025.
Download our SaaS valuation insights report
In our quarterly SaaS valuation insights report, we strive to provide an overview of the latest developments and trends related to valuations accompanied with our proprietary insights and learnings from live projects and observations from engaging with both clients, strategic buyers, and investors in our cross-border advisory practice.
The full SaaS valuation insights report can be downloaded by clicking the link below, and the report will also be published on our website on a quarterly basis.
Ruben Moring, Partner
Juuso Marttinen, Partner
Hao Pan, Analyst
